

Spokane Roofing Report 2025

Bottom Line Up Front: The annual number of roofing permits have been steadily increasing since 2014.
Research Questions:
1. What is the average count of roofing permits submitted per month?
2. What is the average count of roofing permits submitted per day?
3. What is the average count of roofing permits submitted per year?
4. What year had the highest number of roofing permits on file?
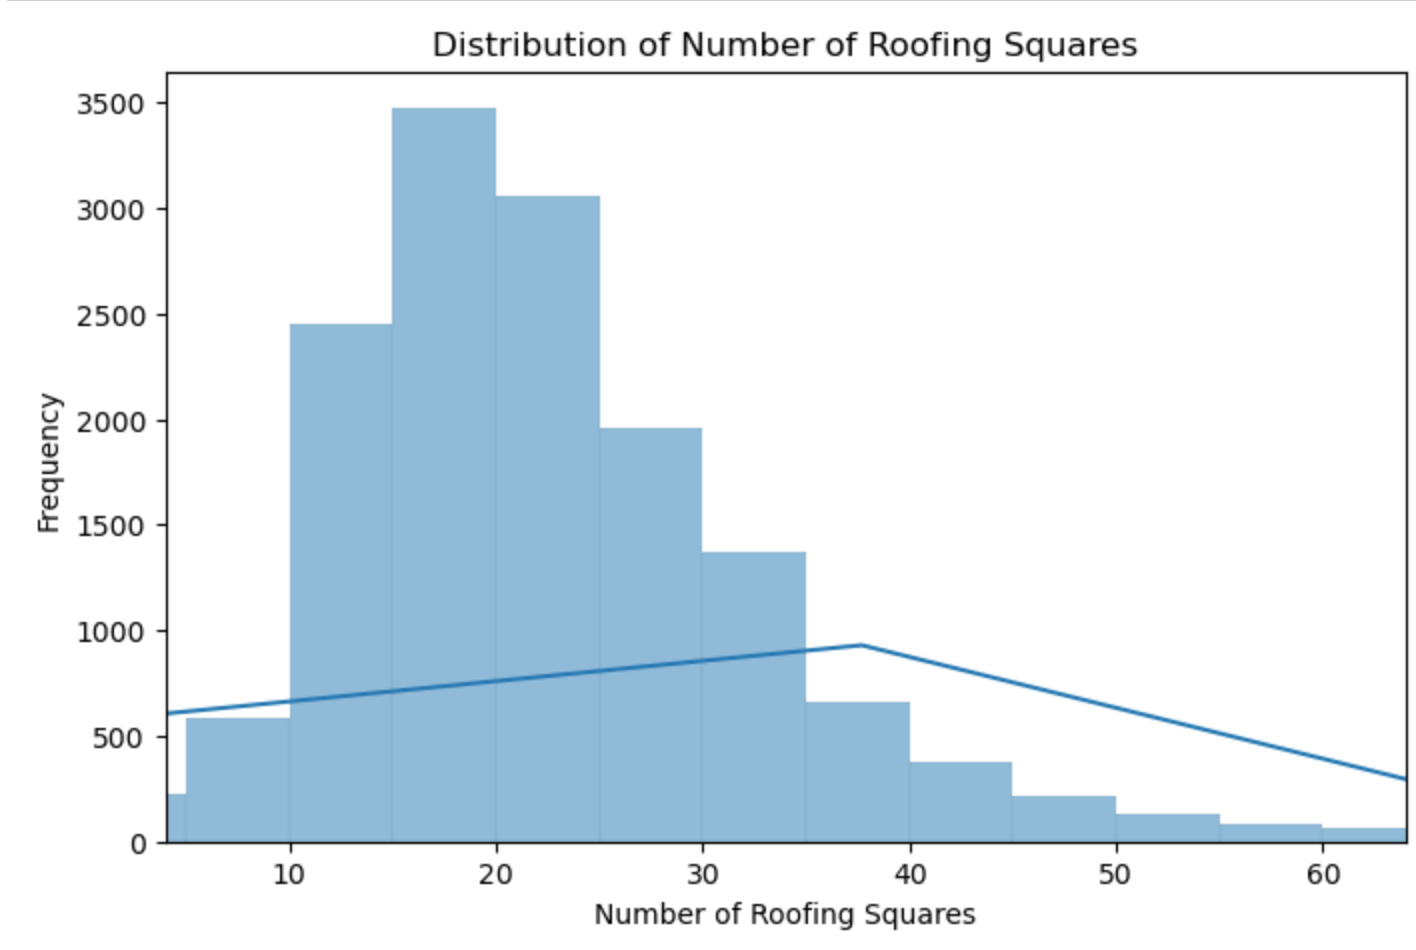
5. What is the average number of roofing squares required per residence?
6. How many Spokane addresses have no roofing permit on file for the last 20 years?
7. Can a predictive model be developed from the data?
Null Hypothesis (H₀):
The forecasting model does not significantly improve the accuracy of predicting the number of annual roofing permits.
Alternative Hypothesis (H₁):
The forecasting model significantly improves the accuracy of predicting the number of annual roofing permits.
Context:
The contribution of this study to the field of Data Analytics and the Spokane roofing industry is to create a predictive test to investigate yearly roofing permit frequencies. With data analytics we will visualize the beating heart of the Spokane roofing industry. With this information a roofing company / contracting company / or marketing company can maximize the investment put into advertisement.
An article titled, Analysis Roofing Quality Control Using Statistical Quality Control Type, showcases a study using forecast testing to explore identical variables of time and quantity (iposcience, 2016). They found that these variables are key factors in overall roofing production.
The forecast tests used are Random Forrest, Season Auto Regressive Incremental Moving Average with Exogenous factors (SARIMAX). These test the null hypothesis, that a forecasting model cannot improve the forecast accuracy. Additionally, Random Forrest is a non-parametric test, while SARIMAX is a parametric test because the data must be successfully differenced (evoking parameters); Ergo, SARIMAX is parametric (statsmodels.org, 2023). Understanding these variables can help describe the relationship between the independent variable and dependent variable. Lastly, a basic linear regression is run to a dead-reckoning forecast with the line of best fit.
Data:
The following roofing report was compiled after extensive data requests, research hours, and big data engineering. The data was sourced from the city of Spokane and is over 28,407 instances of roofing permits for residential buildings for the last 20 years; Exploring the variables of “Date_Applied”, “Address”, and “Number of Roofing Squares”. Moreover, the variable “Yearly_Frequency” was created as the target variable for prediction. Also, the Date_Applied column is parsed into three separate columns: “Days”, “Months”, “Years”. Importantly, the dataset is limited to only 12 years of roofing square data, since the city of Spokane did not begin collecting that metric on roofing permits until 2012; Spanning the years of 2005 – 2024, the dataset has four columns for exploration.

Data Gathering:
Planed and directed data gathering in coordination with the City of Spokane. Meticulously searching for individual roofing permits containing the variables: “Address”, “Date”, “roof size”. Then transferring that raw data to a csv file. Sourced from the city means that it may be limiting in accuracy and completeness. In forecast modeling, the dependent variable must be a continuous (interval or ratio) level of measurement (Statology, 2019). Fortunately, all dependent variables are continuous. The dataset is 50% sparse for the Roofing_Squares column only.
Data Analytics Tools and Techniques: A histogram plot was used to visualize the distribution and inspect for normality. Random Forrest is germane to studying this data because it is very robust to outliers and missing data from all distribution types. However, the SARIMAX does assume normality in the data or differencing prior and tested via the ADFuller Test (Statsmodels.org, 2023). Overall, this is an exploratory quantitative data analytic technique and a descriptive statistic. The tools used will be Jupyter Notebook operating in Python code, running statsmodel api as a reliable open-source statistical library. Due to the data size, a Pandas data frame will be called, same with Numpy and Seaborn will be used for visualizations. The stated forecast tests of Random Forrest will be called using the sklearn libraries and SARIMAX will be the statistical test used with statsmodel’s ADfuller, SARIMAX function. At the same time, presentation layers of Univariate and Bivariate graphs will be added in addition to model performance plots. Lastly, Linear Regression from sklearn will be employed to more hastily gauge a clear frequency trend over the last 10 years of permits. Linear Regression is parametric test that requires the frequency distribution to be perfectly “bell-shaped”, parametric, or “Gaussian” (NLC.uk, 2016).
Justification of Tools/Techniques:
Python will be used for this analysis because of Numpy and Pandas packages that can manipulate large datasets (IBM, 2021). The tools and techniques are common industry practice and have consensus of trust. The order of first differencing will be called with the .diff() function. The technique is justified through the integer variables necessary to plot against a timeline. In so doing, may just reveal different modes of frequency distribution. Another reason why forecast tests are ideal is because it allows exploration of human behavior, historically skewed but may include some form of unseen seasonality. Because of the size of the dataset, pandas and Numpy will be called. Python is being selected over SAS because the Python has better visualizations (Panday, 2022).
Project Outcomes: To find statistically significant differences, the proposed end state is an attempted forecast using Random Forrest and SARIMAX prognostic statistical models of yearly roofing permit counts (Statology,2019). A visualization of the frequency distribution of Months, Days, Year, and Roofing Squares. A cleaned dataset of all the correctly labeled columns and rows, for replication upon request. A better understanding of previously stated groups with exploratory graphs, giving support as to when roofing permit engagement maybe highest. Lastly, a copy of the Jupyter NoteBook with the Python code will be available, along with a video presentation. According to the same study forecast inference models were instrumental in support for alternative hypothesis, against other categorical variables. (iposcience, 2016).
A link to the python code can be found here for scientific replication: Github Code

Spokane roofing season picks up in April every year. Notice how frequency of Months is on a bell shape curve, while Days of the month appears uniform distribution. The average roofing permit per month is lowest in the winter and highest in the summer. Averaging around 1100 roofing permits a year and calculating into 1100 / 365 = 3 permits per day.

Fun Fact: The average roof requires 23 squares to cover it. Notice the graph with showcasing the frequency distribution of roofing square quantities needed against the count of roofing permits.
The graph of Years starts at 2005 and ends in 2024 with some new permits on file in 2025. Take note of the upward sloping trend in the Years graph, starting at 2013. 2016 appears to have been an outlier year as the highest for roofing permits in the last 20 years.
Therefore, 2036 will most likely be a good year for the Spokane roofing industry (assuming a 20-year roof life).

However, when it comes to predicting the yearly frequency, we want to target the years that facilitate the right skew. Therefore, we will now limit the dataset to the last 10 years starting at 2014.

The next graph is a statistical prediction, using linear regression, to forecast the next five years of roofing permits being submitted; Based on the years of 2014 - 2024. After various optimization attempts with Random Forrest, its Gradient Boost variant, and incorporating a LOESS smoothing curve, no accurate predictions could be made.

The above Random Forrest prediction showcases the how the model is not able to generate a prediction, giving the next five years the same answer. This is the case because the distribution appears to be too random. Next attempting to use a SARIMAX model after invoking stationarity via the order of first differencing and reconfirming with the ADFuller test; The SARIMAX model yielded the same result as before, failing to pick up on the pattern and predicting the same prediction for the next five years.

However, what if we just draw a straight line and go for basic algebra of y = mx+b. While that is not statistically sound nor does the distribution fit the assumptions of Linear Regression, it is a hasty forecast based on a human identified pattern and a straight line.

Below is a graph of the output for the Linear Regression model in python. Notice how Year is on the ‘x’ axis and number of permits are on the ‘y’ axis. The blue line connecting the blue dots in the upper right corner are the predicted line of best fit.

2

The data suggests the Spokane roofing industry is going to be good, predicting 1927 roofing permits submitted for the 2025 season. There are around 35 Google Business profiles of active roofing companies in Spokane. All things being equal: 1927 / 35 = 55 Residential Roofing Replacements per company for the 2025 season.
In Final Analysis:
1. What is the average count of roofing permits submitted per month?Lowest in the winter, rises in April, peaks in May, sustains its peak until September, and decreases sharply.
2. What is the average count of roofing permits submitted per day?Approximately 3 a day.
3. What is the average count of roofing permits submitted per year?1100
4. What year had the highest number of roofing permits on file?2016
5. What is the average number of roofing squares required per residence?23 Roofing Squares
6. How many addresses have roofs 20 years old and no new permit on file?There are 252 unique homes in Spokane with no new roofing permit on file in the last 20 years for the 2025 roofing season. Each instance is a roof replacement estimating around $19K in basic labor and materials (not including other costs + markup) [[ Contact for the list if interested ]].
7. Can a predictive model be developed from the data?
No, just a hasty Linear Regression model, intended for dead reckoning only, and not serious statistical probability.
Lastly, we accept the Null hypothesis H0: The forecasting model does not significantly improve the accuracy of predicting the number of annual roofing permits.
Importantly, this research paper visualizes the beating heart of Spokane roofing and gives some interesting insights. Since 2016 is the highest in the 20-year span, we can infer that 2036 will be another good year for roofing businesses. Additionally, the upward trend in permits over the last 10 years maybe due to the homes original build date. The trend may be representative of an urban sprawl. Maybe this trend is a smaller part of a larger pattern when homes were built. More data needs to be compiled to assess the trends over time. In the meantime, the Spokane roofing industry appears promising with the year over year rise in roofing permits.
At 3 permits a day. There are around 35 Google Business profiles of active roofing companies in Spokane. All things being equal, there are 55 Residential Roofing Replacements per company for the 2025 season. However, the Pareto Principal (80/20 Rule) tends to take effect in most economies, where 80% of the work is done by 20% of the companies. As for the list of qualified 252 homes for the 2025 season, if the house has a new roof, then they don’t have a permit on file.
Work Cited
IBM products. IBM. (n.d.). https://www.ibm.com/cloud/blog/python-vs-r
Numeracy, Maths and statistics - academic skills kit. (n.d.). https://www.ncl.ac.uk/webtemplate/ask-assets/external/maths-resources/statistics/regression-and-correlation/assumptions-of-regression-analysis.html
Pandey, Y. (2022, May 25). SAS vs python. LinkedIn. https://www.linkedin.com/pulse/sas-vs-python-yuvaraj-pandey/
Radware bot manager Captcha. (n.d.). https://iopscience.iop.org/article/10.1088/1757-899X/864/1/012085/pdf
Sarimax and Arima: Frequently asked questions (FAQ)¶. SARIMAX and ARIMA: Frequently Asked Questions (FAQ) - statsmodels 0.15.0 (+617). (n.d.). https://www.statsmodels.org/dev/examples/notebooks/generated/statespace_sarimax_faq.html

Powered by Data Mining Mike: Your Doorway to Data