

Market Basket Analysis for Prescription data.
Bottom Line Up Front: Abilify is the most associated drug amongst patient prescriptions.
A major hospital chain has a loss of revenue issue due to the fines imposed as a result of readmitting patients. The overall goal is to understand the patient base through their prescriptions data; Specifically, to identify common pairs, groups, or associations of drugs that are prescribed and how that is reflective of the patient population. The method used is an Unsupervised Machine Learning algorithm called, Market Basket Analysis (MBA). MBA can help in classification of rules that can have data-driven effects on hospital operations. It can also give a prediction of how often these rules apply. The hospital has provided a dataset containing 15002 instances of patients getting prescribed one or many of the 119 drugs offered. The dataset was transformed and analyzed in accordance with MBA. MBA was applied to answer the question: What drug(s) are most associated when prescriptions are issued?
One goal of this analysis is to find what associations exist between drugs prescribed. Explaining the assumption behind MBA is a 2022 article stating, “The approach is based on the theory that customers who buy a certain item (or group of items) are more likely to buy another specific item (or group of items)” (smartbridge.com). Not only can this “basket” be for shopping, it can also be used for prescriptions. According to datacamp.com, “Market Basket Analysis is a powerful tool for translating vast amounts of customer transaction and viewing data into simple rules for product promotion and recommendation. It uses lists of transactions to identify useful associations between items. Such associations can be written in the form of a rule that has an antecedent and a consequent” (2022). MBA finds the frequency then probability of items being correlated with an instance; Plus, it is based on the Apriori algorithm which does just that. Outputting base metrics such as support, lift, and confidence. These metrics are simple linear algebra based on frequencies of commonly occurring item sets. These item sets can have one or many antecedents / consequents. The antecedents and consequents are arranged in to ‘if – then’ statements then classified as Association Rules.
Exploring the meanings of these metrics further with a 2016 article from KDnuggets.com, “Support says how popular an itemset is, as measured by the proportion of transactions in which an itemset appears. Confidence is how likely item Y is purchased when item X is purchased, expressed as {X -> Y}. Lift is how likely item Y is purchased when item X is purchased, while controlling for how popular item Y is” (Annalyn Ng). Furthermore, these metrics can be manipulated first in the apriori() function with the support threshold, because support is the base metric. Additionally, each subsequent metric’s threshold can be manipulated in the association_rules() function. The processes of manipulating the thresholds and resulting in a different number of rules, is referred to as “pruning”. The optimal yield is a low number of association rules with strong metrics indicating cause and effect. MBA first requires the dataset to have the item (drugs) names to be column names and the instances of items, coded into Boolean Logic with no null columns. Likewise, the dataset must not contain any rows with containing no values or only ‘0’s because it the outcome will be effected. The outcome will be a list a of rules indicating the which drugs are prescribed together with probability metrics based off the dataset.
The below a screen shot displays the code used to transform the raw imported dataset for MBA then scrubbed for null columns. Additionally, the output is also displays the data frame format necessary for MBA along with the first four transactions.

Below is an example of the code needed to drop the all the missing columns and rows containing only “False / nan ” values. The remaining dataset is now void of rows and columns containing such and is ready for MBA processing.

Here is an example of the 4th transaction and results of 119 different drugs. In this instance a patient was prescribed ‘amphetamine salt combo’, ‘benicar’, and ‘citalopram’.

The following screenshots show the code used for the main process of MBA. The Association rules are derived from calling the apriori() function and setting the support = 0.02; Kept in an object named “a_rules”. The output generates the items that contain the stated threshold, and it appears that abilify has a significant lead over the others generated, with a support of 0.02. That means that we want the function to fetch all drugs that pair together at least 2% of the time.

Next, calling the association_rules() and passing the apriori object to generate the ‘lift’ metric. Concurrently, the same function calculates all the subsequent metrics. Displayed below are all drugs containing a lift >= 1. A lift greater than 1 shows a higher probability of the items occurring together. If lift <= 1, then the items are independent. Lift is a ratio that acts as a force-multiplier of dependence.

Now creating a separate data frame with a condition to prune the number of rules and keep only rules with 20% confidence. The final code is sorting the pruned data frame and ranking the rules by lift. Displayed are the top three rules with the most relation.
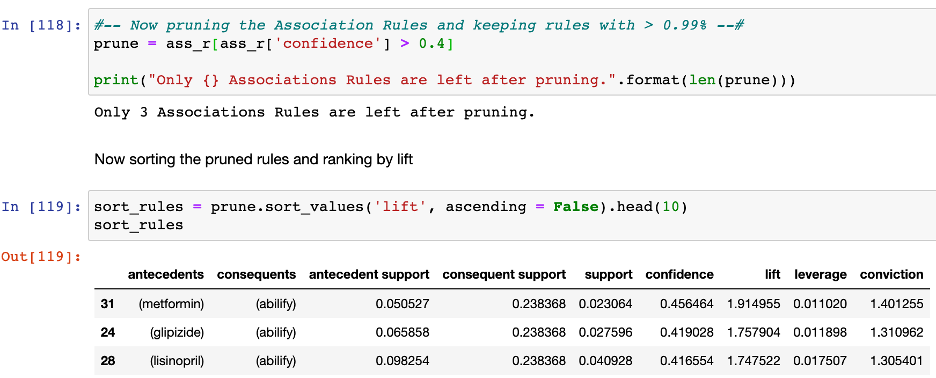
In final analysis, three rules remain. The top three rules are left-indexed as rules 31, 24, and 28. Notably ranking number 1 is rule 31: If metformin (antecedent) then abilify (consequent). With a support of 0.023, confidence of 45.6%, and lift of 1.91; Indicating that if metformin is prescribed then there is a 45.6% chance that abilify will be prescribed too. The next drug pair, ranking 2nd (indexed as rule 24): If glipizide (antecedent) then abilify (consequent). That rule has a support of 0.027, confidence of 41.9, and lift of 1.75. The third ranked rule is lisinopril (antecedent) and abilify (consequent) with a support of 0.04, confidence, of 41.6 and lift of 1.74. Significantly, abilify occurs in all nine Association Rules and all have lifts > 2 and confidence > 20%. Additionally, according to the data, these rules happen two percent of the time and 9 rules x 0.02 = 18%, of the prescription instances have abilify. Further understanding of abilify’s effect on patients’ hospital readmissions may be something to explore and along with Association Rules containing abilify.
Work Cited
Association rules and the Apriori Algorithm: A tutorial. KDnuggets. (n.d.). Retrieved August 10, 2022, from https://www.kdnuggets.com/2016/04/association-rules-apriori-algorithm-tutorial.html
Confidence and lift: Python. campus.datacamp.com. (n.d.). Retrieved August 10, 2022, from https://campus.datacamp.com/courses/market-basket-analysis-in-python/association-rules?ex=1
Smartbridge. (2022, July 5). Market basket analysis 101: Anticipating customer behavior. Smartbridge. Retrieved August 15, 2022, from https://smartbridge.com/market-basket-analysis-101/